These computer generated models shown below illustrate the effects of cell phone radiation. They were independently created by a Canadian university and a South African research company specializing in electromagnetic studies.
The Applied Electromagnetics Group in the Department of Electrical and Computer Engineering at the University of Victoria, Victoria, British Columbia, Canada has developed computer generated models illustrating the effects of mobile phone and power line radiation since 1995. Their rf exposure models are based upon rf radiated power measurement in dB, which is the same measurement criteria used by RF Safe.
The descriptions presented below were created by the computer model developers and have not been modified.
It should be noted the models do not illustrate the effects of continuous phone use after the SAR level is reached, such as during a conversation. Model are only showing exposures of up to current FCC safety standards and remember that most cell phones will exceed this when talking longer than 5 minutes!
Below Computer Models By Applied Electromagnetics Group

RF Power Deposition From A PCS Cell Phone Inside Your Head.
Colors varying from blue to red illustrate the SAR when the phone is placed against the head. The power is in dB and is relative to the point of the model where the maximum SAR occurs. In this case, the head.
*Computer Model Picture Full size image (84 seconds @ 28.8kbps).
RF Power Deposition From A PCS Cell Phone On The Heads Surface And Inside A Hand
 Showing A Cell Phone Held At 30 mm (1.18 in.) away from the heads surface. The power is in dB and is relative to the point of the model where the maximum SAR occurs. In this case, the Hand reaches max SAR limits before the head.
*Computer Model Picture Full size image (98 seconds @ 28.8kbps).
 Modeling EMI In A Hospital Environment
Cell Phone Transmitting Exposure. Evaluation of a power deposition on the body surface from a cellular phone transmitting inside a hospital room.
*Computer Model Picture Full size image (203KB) (110 seconds @ 28.8kbps).
Modeling Electric Potential and Current Flow Inside Living Cells
Each cell shown below is modeled as a thin membrane of low conductivity surrounding the cytoplasm (modeled as a homogeneous conductive material). The cells are connected by gap junctions – areas of the cell membrane that are of increased conductivity.
Living Cell Model 1
 Chain Of 2 Cells Immersed In A Conductive Medium
Electric field of 1V/m is applied to the medium along the axis of symmetry. Due to that only one octant of space needs to be modeled. Gap junction connecting the two cells is located in the octant corner. Color shows the potential distribution in the membrane. The red in the figure represents 1.2 microvolts and the blue is zero.
*Computer Model Picture Full size image(8 seconds @ 28.8kbps).
Living Cell Model 2
 Conduction Current Flow In A 2x2x2 Cluster Of Cells
Cluster is in a conductive medium to which the electric field of 1V/m is applied, directed along the vertical axis. Due to symmetry, only one octant which contains one full cell needs to be modeled. Gap junctions are shown as small circles in the cell walls touching the adjacent cells. Red in the figure represents current density of 1.5 mA per square meter while the blue is zero. Cell size is 1 micrometer.
*Computer Model Picture Full size image (15 seconds @ 28.8kbps).
Below Computer Models By EM Software and Systems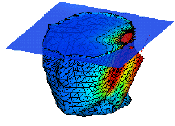
Cellular Phone Power Absorbed In The Head Of A Cell Phone User
Computer models of specific absorption rate (SAR) calculation. SAR is the measure used by the FCC to determine compliance with non-ionizing radiation hazard standards. Shown below is an example where the surface equivalence principle has been used to determine the fields inside a homogeneous phantom head when a mobile phone is placed against it. The “surface currents” on the dielectric can be seen on the cheek of the phantom. The cutplane through the head illustrates the fields which are used for the SAR calculations.
*Computer Model 1 Picture 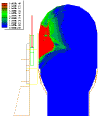
RF Power Absorbed In The Head Of A Cellular Phone User – Front View
*Computer Model 2 Picture Full size image (6 seconds @ 28.8kbps)
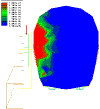
Power Absorbed In The Head Of A Cellular Phone User – Top View
*Computer Model 3 Picture Full size image (5 seconds @ 28.8kbps)
Power Absorbed In The Head Of A Cellular Phone User 3 Dimensional View
*Computer Model 4 Picture Full size image (33 seconds @ 28.8kbps
RF EXPOSURE WHEN USING A CELL PHONE IN A CAR BELOW
 Currents Flowing On A Vehicle With An Antenna Located Inside The Vehicle
*Computer Model Picture Clear Full size image (16 seconds @ 28.8kbps).
Currents Flowing On A Person With An Antenna Located Inside The Vehicle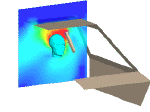
*Computer Model Picture Full size image (5 seconds @ 28.8kbps).


